Both boards feature their own processor and local memory. As a result, the baseband board continues operating independently using its stored configuration, even when the control/display board is disconnected. This makes the system particularly well suited for unattended applications such as repeaters.
Communication between the boards is handled over an I²C interface.
An example Python application for controlling the baseband board is available on GitHub:
https://github.com/pe1obw/baseband_config
Firmware updates are continuously being developed and can be installed through the onboard ESP32 module (located on the rear side of the display board) using a standard USB cable.
The update mechanism is fail-safe, making the likelihood of a failed update extremely small. FPGA firmware updates — for the FPGA that forms the core of the baseband board — are bundled together with the ESP32 firmware image. The startup menu will automatically guide the user through the update process.
The procedure is intentionally straightforward and therefore requires no additional documentation.
General
The supported supply voltage range is 8V to 15V DC.
Power consumption is relatively low:
- approximately 1.75W at 12V with the display fully enabled
- approximately 920mW for the baseband board alone
Recent firmware expansions and additional functionality have increased overall power consumption only marginally.
Because the design uses switching regulators, the total power draw remains fairly consistent across the supported input voltage range, whether operating from 8V or 15V.
PE1MUD can confirm from practical experience that applying 31 volts results in a loud and highly undesirable “boom,” so please exercise some restraint and respect the 15V maximum rating.
The board includes two status LEDs:
| LED | Function |
|---|---|
| POWER | Indicates that the power supply is operating correctly |
| DONE | Indicates that the FPGA has successfully loaded its firmware and is running properly |
Connections
Connection cables are included with the system. The supplied wiring is not shielded, but this is generally not an issue provided the cables are kept reasonably short. Connector locations and signal assignments are clearly marked on the PCB silkscreen.
The supplied JST-XH connectors (2-pin, 3-pin, and 4-pin) must be installed with their openings facing toward the inside of the PCB. When oriented correctly, the connectors align precisely with the printed outlines on the board.
Pay close attention to connector orientation, especially when connecting the display module.
Incorrect wiring may result in hardware damage — and sadness.
If in doubt, simply trace each cable from connector to connector and verify that the silkscreen labels match on both ends.
You are, of course, free to use alternative connectors or shielded cabling if preferred. This is also the reason why certain connectors are not pre-soldered to the PCB.
Assembly and production testing were performed using the test pads located on the underside of the PCB in combination with pogo-pin fixtures. Every board has therefore been fully tested prior to shipment.
Display Board Assembly
If the display board still needs to be assembled, the assembly instructions can be downloaded here:
External Power Supply Usage
The +5V, -5V, and +3.3V supply rails are available on an optional connector position intended for a 4-pin 1.5mm JST connector.
The onboard power supplies have been designed with sufficient headroom and can provide approximately 500mA per rail for external circuitry.
When powering external devices from the baseband board, care should be taken to avoid introducing noise or interference onto the supply rails. Add additional decoupling or filtering where necessary.
FPC Expansion Connector
The baseband board includes PCB pads for an optional fine-pitch FPC connector.
This connector provides access to the audio ADC signals and also supports two external stereo I²S audio inputs. In this configuration, the baseband board operates as the I²S master with a fixed sample rate of 64kHz.
In addition, two external pushbuttons may be connected, allowing configuration of the baseband board through the on-screen display (OSD) interface.
The same precautions mentioned in the previous section regarding power supply noise and decoupling apply here as well.
| Pin | Signal | Description | Direction |
| 16 | +5V | ||
| 15 | +3V3 | ||
| 14 | +3V3 | ||
| 13 | audio_adc_dout1 | Data out from ADC 1 | out |
| 12 | audio_adc_dout2 | Data out from ADC 2 | out |
| 11 | audio_scki | ADC/I2S 24.576 MHz system clock | out |
| 10 | audio_bck | ADC/I2S 4.096 MHz bit clock | out |
| 9 | audio_lrck | ADC/I2S 64 kHz lr clock | out |
| 8 | unused | ||
| 7 | unused | ||
| 6 | audio_din1 | I2S input 1 | in |
| 5 | audio_din2 | I2S input 2 | in |
| 4 | pushbutton_select | Pushbutton (other side to ground) | in |
| 3 | gnd | ||
| 2 | pushbutton_inc | Pushbutton (other side to ground) | in |
| 1 | gnd |
Display Board Software
Versions 1.00 and 1.4 of the display board software are available on GitHub.
Users are encouraged to modify and extend the software as desired. The only condition is that any improvements, modifications, or derivative projects are shared back with the community as well.
User Interface and Operation
System control is performed using a rotary encoder with an integrated pushbutton.
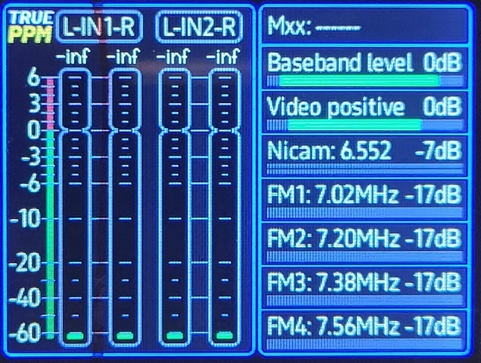
After startup, the system opens on the main screen featuring the broadcast style PPM meters.
When no parameter is selected, repeatedly pressing the encoder button cycles through the available screens:
- the main operating screen
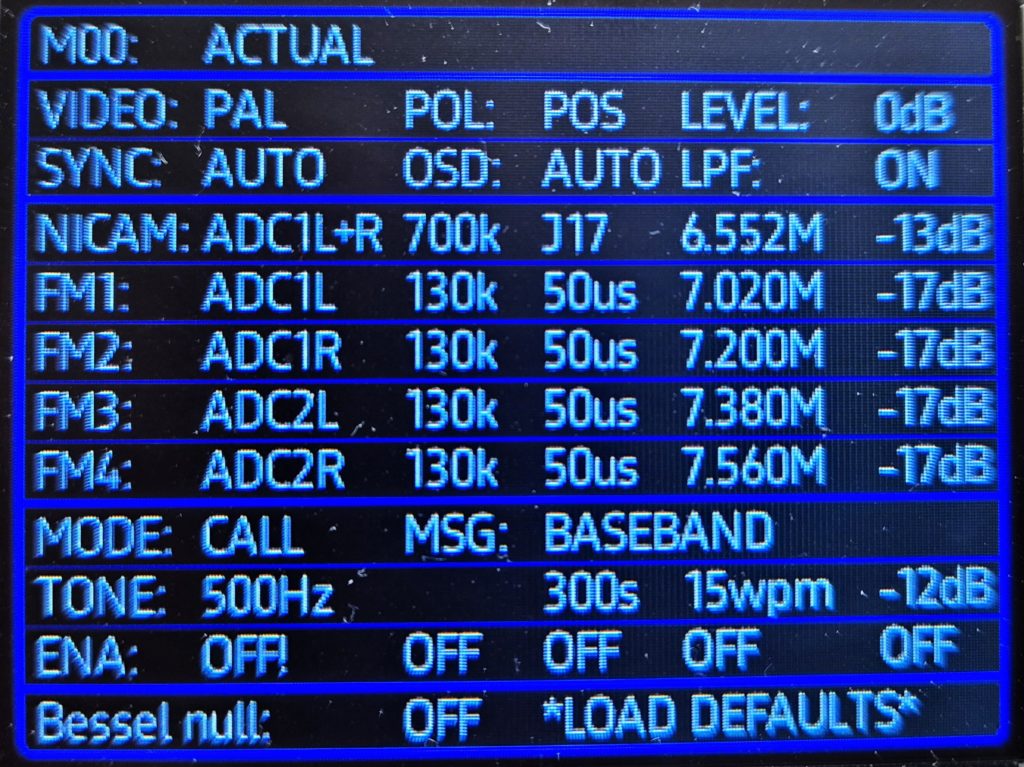
- the menu screen with settings for Video, Audio, call generator, Bessel null
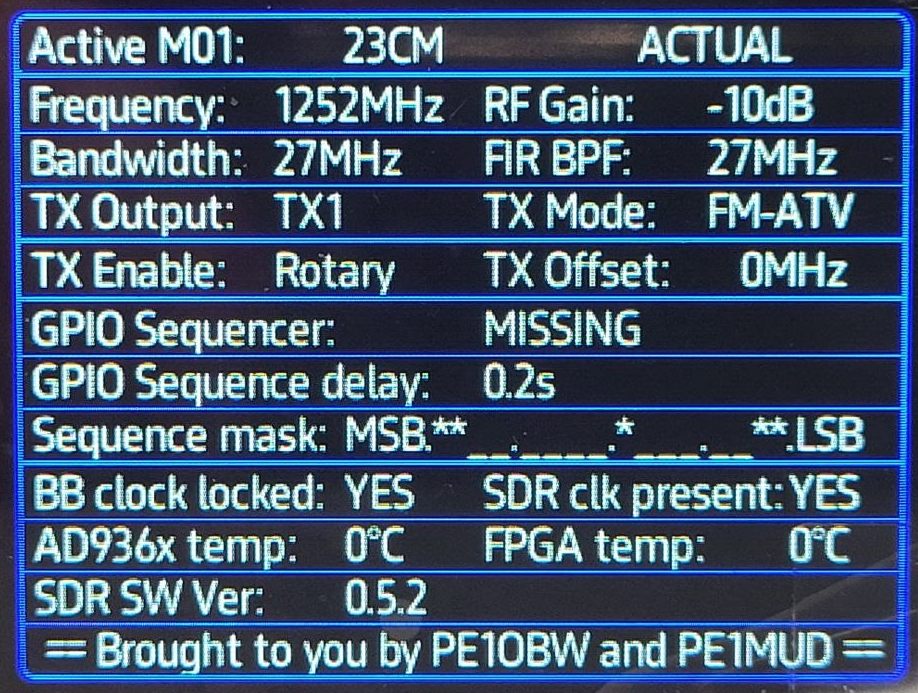
- the SDR control screen (v2.0 onwards)
- additional settings screens; testcard, OSD, VITS line configuration
- and finally the title screen featuring the PCB image
While on the title screen, rotating the encoder adjusts the display brightness.
Navigating Settings
Within the settings screens, rotating the encoder scrolls through the available parameters.
To modify a parameter:
- Briefly press the encoder button to enter adjustment mode
- Rotate the encoder to change the value
- Briefly press the button again to exit adjustment mode
Once adjustment mode is exited, rotating the encoder again selects other parameters.
Several settings also provide additional functionality through a long button press.
Enabling and Disabling Video & Carrier Outputs
The video output and all carrier generators can be enabled or disabled independently.
To control a carrier:
- Select the desired level parameter (displayed in dB)
- Briefly press the button to enter adjustment mode
- Press and hold the button for more than one second
The displayed dB value will change to OFF.
Repeating the long press restores the previously configured output level.
Restoring Default Settings
To use the Load Defaults function:
- Select the function using the rotary encoder
- Briefly press the button — the text will turn green
- Press and hold the button for more than one second
All settings will then be restored to their default startup values.
Hidden Feature
One final secret feature:
When adjusting the frequency of the tone generator or Morse generator, pressing the encoder button while rotating enables large frequency steps.
This exists primarily to prevent users who absolutely need a 13kHz Morse tone from resorting to power tools for rapid encoder rotation. (Yes, PE1MUD actually did this.)
Baseband and Video Levels
The meter labeled “Baseband Level” displays the full operating range of the 12-bit DAC that generates the composite baseband signal.
The green bar indicates the current signal level within the available output range. It is important to ensure that the combined sum of the video signal and all enabled carriers does not cause overdrive.
If the signal exceeds the available DAC range, output clipping will occur. Clipping introduces increasing amounts of unwanted spectral products and distortion into the transmitted signal.
When clipping occurs, the meter changes to red.
The baseband output is DC-coupled and centered approximately around 0V.
The meter may appear to “wander” or fluctuate slightly, especially when the audio carriers are unmodulated. This behavior is completely normal. The system does not generate pure continuous sine waves, but instead produces a complex composite baseband signal with non-continuous amplitude characteristics.
Some movement of the meter should therefore be expected.
The “Video Positive” meter operates similarly and displays the level of the 10-bit video input ADC.
The ADC input range is 2Vpp, providing ample headroom for standard 1.3V video signals.
The video input is DC-coupled, and the applied signal should be adjusted such that the input ADC does not clip.
NICAM and FM RF Levels
The officially recommended NICAM RF level is -13dB relative to the video carrier. For FM audio carriers, the recommended level is -17dB relative to the video carrier.
These values are not arbitrary recommendations from us, but are based on official ITU guidelines.
Using these recommended levels generally ensures that the audio remains reliable as long as the video reception itself remains acceptable (i.e. free from excessive noise or visible “sparkles”).
However, as radio amateurs, we often operate over weak links where the video may already contain visible noise, sparkles, or worse. In those situations, feel free to experiment.
Increasing the NICAM or FM carrier levels — or even reducing the video level by a few dB — can provide additional headroom at the baseband output while improving audio intelligibility under marginal reception conditions.
If the received video quality is already poor and audio intelligibility becomes the priority, there is little reason to keep the video carrier unnecessarily dominant. Lowering the video level slightly may also help reduce occupied channel bandwidth.
In short: experiment and optimize for your specific link conditions.
If you are observing the signal on a spectrum analyzer and notice that the displayed NICAM level appears incorrect, please read the following section:
NICAM carrier power
ITU (and CCITT) standards specify that the power level of the NICAM signal should be at -20 dB with respect to the power of the vision carrier.
- The level of the FM mono sound carrier must be at least -13 dB.
- Measuring the modulation level of the NICAM signal is difficult because the QPSK NICAM carrier waveform (unlike AM or FM modulated carrier waveforms) is not emitted at a discrete frequency.
When measured with spectrum analyser the actual level of the carrier (L) can be calculated using the following formula:
L(NICAM) = L(Measured) + 10 log (R/BWAnalyser) + K
- L(NICAM) = actual level of the NICAM carrier [dBμV]
- L(Measured) = measured level of the NICAM carrier [dBμV]
- R = -3 dB bandwidth of the signal [kHz]
- BWAnalyser = bandwidth of the spectrum analyser [kHz]
- K = logarithmic form factor of the spectrum analyser ~2 dB
note: if BWAnalyser is greater than R, the formula becomes L(NICAM) = L(Measured) + K
Source: https://en.wikipedia.org/wiki/NICAM
You therefore cannot directly determine the actual NICAM modulation level simply by looking at the signal on a spectrum analyzer.
Incidentally, the values mentioned here — -20dB for NICAM and -13dB for FM audio — apply to VSB transmission systems (AM with a suppressed sideband), such as those historically used in cable television systems.
For FM-TV transmission, the recommended carrier levels are different.
Audio Input Levels
The audio level meters display the signal levels present at the audio inputs. They do not indicate the levels being applied to the RF audio carriers.
For the audio input stages, the Digital Baseband board uses the PCM1808 audio ADC.
According to the PCM1808 datasheet:
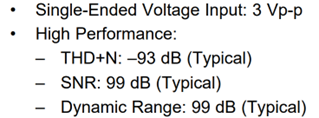
And yes — the design actually meets those specifications.
The board is exceptionally quiet. There is no audible digital noise, switching artifacts, or power supply interference, despite the presence of four onboard switching regulators.
We use the ADC’s 3Vp-p input range somewhat differently than conventional consumer line-level audio equipment. Instead of operating right at the nominal full-scale input level, additional headroom has intentionally been reserved, following common professional audio design practices.
The system is configured with approximately 12dB of headroom — roughly a factor of four in voltage. As a result, the meter already reaches 0dB at approximately 0.75Vp-p input level.
The displayed meter is a true PPM (Peak Program Meter), not a slow averaging VU meter that merely estimates signal level over time.
(As we all know, VU stands for “Virtually Useless.”)
This meter measures actual signal peaks and does not miss transient overload conditions.
FM Modulation
According to ITU recommendations, a 0dB audio input level corresponds to 50% FM deviation at unity gain, measured at 400Hz (or with pre-emphasis disabled).
This leaves approximately 6dB of digital headroom before reaching the FM clipper, which operates in a very firm and unforgiving manner. On top of that, the analog input stage itself still provides an additional 6dB of headroom.
This extra margin is necessary because pre-emphasis boosts higher audio frequencies by up to approximately 14dB. As a result, high-frequency content can reach the clipping threshold much sooner than lower-frequency material. If high-frequency audio already enters at 0dB, clipping may occur rapidly once the signal approaches the +6dB FM limit.
FM clipping activity is indicated by the meters located below the FM1, FM2, FM3, and FM4 settings.
Occasional brief excursions into the red region are generally inaudible, but heavier clipping will quickly become noticeable in the transmitted audio. As always: if it starts sounding unpleasant, you are probably overdriving it.
If you are using dedicated FM audio preprocessing designed to properly control modulation levels, it is possible to operate without pre-emphasis and drive the input up to +6dB without clipping.
In other words: welcome to the loudness war.
NICAM Modulation
According to the NICAM specification, approximately 12dB of headroom is required. With J.17 pre-emphasis enabled, that headroom can disappear surprisingly quickly.
For that reason, the best operating practice is to keep the audio meters around 0dB.
NICAM already provides an excellent signal-to-noise ratio, so driving the signal harder generally offers little practical benefit and mostly serves to increase the likelihood of clipping and distortion.
In short: don’t do it.
Like the FM channels, the NICAM processing chain also includes a dedicated clip indicator.
As a general rule, when operating without external audio processing, aim to keep the meters near 0dB and avoid excessive or prolonged excursions into the red region.